Module Introduction
I Real-time Monitoring Data
1. Current Power
Displays real-time cycling power output.
Colors
This is a module that can display background colors. You can choose between two color sequence styles in the ConnectIQ app. However, users cannot customize individual colors or zone ranges.
- Garmin style: Gray-Blue-Green-Yellow-Orange-Red-Purple (Zone 1~Zone 7)
- Wahoo style: Gray-Dark Blue-Light Blue-Green-Yellow-Orange-Red (Zone 1~Zone 7)
Average Power Indicator
This is an on/off setting used to compare current power with average power within the current power module. It can be configured in the ConnectIQ app. Supports "Arrow" display mode.
- "Arrow"
- Up: Above average power
- Down: Below average power
- Not shown: Equal to average power or ride not started
2. Current Speed
Displays current cycling speed. The unit will match your Garmin Connect settings (kph/mph).
Average Speed Indicator
This is an on/off setting used to compare current speed with average speed within the current speed module. It can be configured in the ConnectIQ app. There are two display modes: "Arrow" and "Background".
- "Arrow"
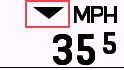
- Up: Above average speed
- Down: Below average speed
- Not shown: Equal to average speed or ride not started
- "Background"
- Red: Below average speed
- Green: Above average speed
3. Current Heart Rate
Displays real-time heart rate data.
Colors
This is a module that can set background colors. You can choose between two color sequence styles in the ConnectIQ app. However, users cannot customize individual colors or zone ranges.
- Garmin style: Gray-Gray-Blue-Green-Yellow-Red (<Zone 1, Zone 1~Zone 5)
- Wahoo style: Gray-Blue-Green-Yellow-Orange-Red (<Zone 1, Zone 1~Zone 5)
Average Heart Rate Indicator
This is an on/off setting used to compare current heart rate with average heart rate within the current heart rate module. It can be configured in the ConnectIQ app. Supports "Arrow" display mode.
- "Arrow"
- Up: Above average heart rate
- Down: Below average heart rate
- Not shown: Equal to average heart rate or ride not started
4. Current Cadence
Displays real-time cadence value.
Average Cadence Indicator
This is an on/off setting used to compare current cadence with average cadence within the current cadence module. It can be configured in the ConnectIQ app. Supports "Arrow" display mode.
- "Arrow"
- Up: Above average cadence
- Down: Below average cadence
- Not shown: Equal to average cadence or ride not started
5. Current Altitude
Displays current altitude. The unit will match your Garmin Connect settings (m/ft).
6. Current Grade*
Displays current grade.
*Garmin does not officially provide a data interface, so calculated data may be inaccurate or incorrect
Colors
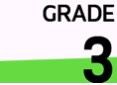
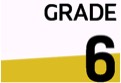
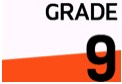
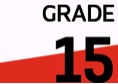
This is a module that can display background colors. Colors change according to the corresponding grade, but users cannot customize colors or grade ranges.
| Example | 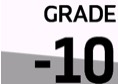 |
 |
 |
 |
 |
 |
|---|---|---|---|---|---|---|
| Grade Range | < 0.5% | 0.5%~3.99% | 4%~7.99% | 8%~11.99% | 12%~19.99% | > 20% |
II Average and Cumulative Data
7. 3-second Average Power*
Displays average power for the past 3 seconds. Color display is the same as real-time power.
*Garmin does not officially provide a data interface, so calculated data may be inaccurate or incorrect
8. 5-second Average Power*
Displays average power for the past 5 seconds. Color display is the same as real-time power.
*Garmin does not officially provide a data interface, so calculated data may be inaccurate or incorrect
9. 10-second Average Power*
Displays average power for the past 10 seconds. Color display is the same as real-time power.
*Garmin does not officially provide a data interface, so calculated data may be inaccurate or incorrect
10. Lap Average Power*
Displays average power for the current lap.
*Garmin does not officially provide a data interface, so calculated data may be inaccurate or incorrect
11. Average Power
Displays overall average power for the current activity.
12. Average Heart Rate
Displays average heart rate for the current activity.
13. Average Speed
Displays average speed for the current activity.
14. Activity Time
Displays duration of the current activity.
15. Elapsed Time (Total Time)
Displays total time for the current activity (including paused time).
16. Lap Time*
Displays duration of the current lap.
*Garmin does not officially provide a data interface, so calculated data may be inaccurate or incorrect
17. Distance
Displays cumulative cycling distance for the current activity.
18. Total Ascent
Displays total elevation gained during the current activity.
19. Total Descent
Displays total elevation lost during the current activity.
20. Lap Average Heart Rate*
Displays average heart rate for the current lap.
*Garmin does not officially provide a data interface, so calculated data may be inaccurate or incorrect
21. Total Work (kJ)*
Displays total work performed during the current activity in kilojoules (kJ). This measurement comes from the power meter, so a power meter is required for it to work.
*Garmin does not officially provide a data interface, so calculated data may be inaccurate or incorrect
22. Lap Distance*
Displays distance covered in the current lap.
*Garmin does not officially provide a data interface, so calculated data may be inaccurate or incorrect
23. Average Cadence
Displays average cadence for the current activity.
24. Lap Average Speed*
Displays average speed for the current lap.
*Garmin does not officially provide a data interface, so calculated data may be inaccurate or incorrect
25. Calories
Displays calories burned during the current activity.
III Maximum Values
26. Maximum Power
Displays maximum power achieved during the current activity.
27. Maximum Heart Rate
Displays maximum heart rate achieved during the current activity.
28. Maximum Speed
Displays maximum speed achieved during the current activity.
29. Maximum Cadence
Displays maximum cadence achieved during the current activity.
30. Lap Count
Displays total laps for the current activity. The lap count will be set to 1 when the activity starts.
IV Training Metrics
31. Current Power-to-Weight Ratio
Displays real-time power-to-weight ratio for the current activity in W/Kg. Power comes from the MyGahoo settings page input, and weight comes from the Garmin profile page configuration.
32. 3-second Average Power-to-Weight Ratio*
Displays average power-to-weight ratio for the past 3 seconds in W/Kg.
*Garmin does not officially provide a data interface, so calculated data may be inaccurate or incorrect
33. 10-second Average Power-to-Weight Ratio*
Displays average power-to-weight ratio for the past 10 seconds in W/Kg.
*Garmin does not officially provide a data interface, so calculated data may be inaccurate or incorrect
34. Lap Average Power-to-Weight Ratio*
Displays average power-to-weight ratio for the current lap in W/Kg.
*Garmin does not officially provide a data interface, so calculated data may be inaccurate or incorrect
35. NP™ (Normalized Power)*
Displays normalized power for the current activity.
Data Loss Risk
If you "re-add" the MyGahoo field during the activity, or enter other riding modes, the data in this module will be cleared. (However, the activity recorded by Garmin itself will not be affected; only MyGahoo will start accumulating this data from zero again).
™Normalized Power (NP) and Training Stress Score (TSS) are registered trademarks of Peaksware, LLC.
*Garmin does not officially provide a data interface, so calculated data may be inaccurate or incorrect
36. TSS™ (Training Stress Score)*
Displays training stress score for the current activity.
Data Loss Risk
If you "re-add" the MyGahoo field during the activity, or return to the current mode after entering other riding modes, the data in this module will be cleared. (However, the activity recorded by Garmin itself will not be affected; only MyGahoo will start accumulating this data from zero again).
™Normalized Power (NP) and Training Stress Score (TSS) are registered trademarks of Peaksware, LLC.
*Garmin does not officially provide a data interface, so calculated data may be inaccurate or incorrect
37. W'Balance*
Displays W'Balance (W prime balance) for the current activity. This requires CP (Critical Power) and W' (W Prime) to be pre-defined to work. For scientific explanations, there are plenty of articles and videos explaining what it is.
During activity, this field can be green or red. When green, it means your current power is below CP, in other words, you are "recovering". Conversely, when red, it means you are depleting.
The current mathematical model uses the Froncioni / Clarke differential model:
W′bal = W′bal + (CP - P) * (W′ - W′bal) / W′ when P > CP
W′bal = W′bal + (CP - P) when P < CP
*Garmin does not officially provide a data interface, so calculated data may be inaccurate or incorrect
38. Current Training Step Remaining Time
Displays countdown remaining time for the current training workout step. Only effective when a Garmin structured workout (Workout) has been started. If the current training step has no time limit, no data will be displayed.
39. IF™ (Intensity Factor)*
Displays the Intensity Factor for the current activity, used to evaluate the intensity level of this training session.
™Intensity Factor (IF) is a registered trademark of Peaksware, LLC.
*Garmin does not officially provide a data interface, so calculated data may be inaccurate or incorrect
V Equipment Information
40. Gear Teeth
Displays the number of teeth for the current chainring/cassette. For example: 52/13
41. Gear Index
Displays the index number of the current chainring/cassette. For example: 1/7
42. Gear Ratio
Displays the gear ratio of the current chainring divided by the cassette teeth. For example: 4.02
43. Gear Ratio Chart
Graphically displays gear ratio information.
VI Navigation Information
44. Distance to Destination
Displays remaining distance to the destination.
45. Estimated Time to Destination*
Displays estimated remaining time to reach the destination. This is estimated based on the average speed so far, and the value will appear 10 seconds after the activity starts to avoid sharp fluctuations at the beginning.
*Garmin does not officially provide a data interface, so calculated data may be inaccurate or incorrect
46. Estimated Time of Arrival*
Displays estimated time of arrival at the destination. This is estimated based on the average speed so far, and the value will appear 10 seconds after the activity starts to avoid sharp fluctuations at the beginning.
*Garmin does not officially provide a data interface, so calculated data may be inaccurate or incorrect
VII Data Analysis
47. Real-time Left-Right Balance
Displays current left-right power balance. Shown as percentage without the % symbol, for example: 52-48
48. 3-second Average Left-Right Balance*
Displays average left-right power balance ratio over 3 seconds.
*Garmin does not officially provide a data interface, so calculated data may be inaccurate or incorrect
49. Power Zone Histogram*
Displays time distribution across different power zones.
Data Loss Risk
If you "re-add" the MyGahoo field during the activity, or return to the current mode after entering other riding modes, the data in this module will be cleared. (However, the activity recorded by Garmin itself will not be affected; only MyGahoo will start accumulating this data from zero again).
*Garmin does not officially provide a data interface, so calculated data may be inaccurate or incorrect
50. Heart Rate Zone Histogram*
Displays time distribution across different heart rate zones.
Data Loss Risk
If you "re-add" the MyGahoo field during the activity, or return to the current mode after entering other riding modes, the data in this module will be cleared. (However, the activity recorded by Garmin itself will not be affected; only MyGahoo will start accumulating this data from zero again).
*Garmin does not officially provide a data interface, so calculated data may be inaccurate or incorrect
51. Pedaling Efficiency
Displays torque effectiveness of the left and right pedals in percentage. Requires a power meter that supports this data interface to work.
- Format: Left% / Right%
- If the power meter does not support side-specific data, only the combined value will be displayed
52. Smoothness
Displays pedaling smoothness of the left and right pedals in percentage. Requires a power meter that supports this data interface to work.
- Format: Left% / Right%
- If the power meter only supports combined data (not distinguishing left/right), only the combined value will be displayed
VIII Environmental Information
53. Clock
Displays current time.
54. Battery
Displays current battery level. Shown as percentage.
55. Temperature (Sensor)
Displays current temperature in Celsius or Fahrenheit. Updated every 5 minutes. The frequency cannot be higher due to Garmin limitations.
56. Wind*
Displays current wind speed and relative/absolute wind direction.
*Garmin does not officially provide a data interface, so calculated data may be inaccurate or incorrect
Wind Speed Units
- m/s: meters per second
- KPH: kilometers per hour
- MPH: miles per hour
- Beaufort scale: wind force scale, levels 0~12
Wind Speed Level
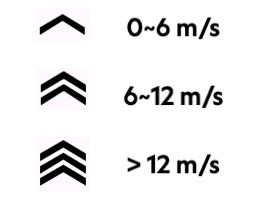
Wind speed level is indicated by the number of arrows, with different numbers corresponding to wind speeds as shown in the figure below. When the selected wind speed unit is not m/s, the number of arrows will still be calculated based on the correct wind speed rather than the displayed number.
Absolute/Relative Wind Direction
- Absolute direction: Wind direction given in weather forecasts, unrelated to riding direction
- Relative direction: The relative angle between current riding direction and wind direction. For example, if riding west with absolute wind direction from north to south, the relative wind direction is from right to left.
Wind Direction Colors
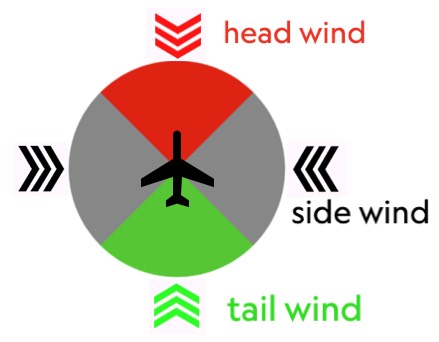
When displaying relative wind direction, arrows are colored according to wind angle. Red indicates headwind (relative wind from 45° left-front to 45° right-front); green indicates tailwind (relative wind from 45° left-rear to 45° right-rear); black indicates crosswind.
Configuration
The wind module needs to be configured in the ConnectIQ app for optimal display. Please refer to the Weather Configuration module for details.
57. Temperature (OpenWeather)*
Displays current temperature in Celsius or Fahrenheit. Data source is OpenWeather, so a valid OpenWeather API configuration is required to enable this data.
58. Feels-like Temperature (OpenWeather)*
Displays current feels-like temperature in Celsius or Fahrenheit. Data source is OpenWeather, so a valid OpenWeather API configuration is required to enable this data.
59. Humidity (OpenWeather)*
Displays current relative humidity as percentage. Data source is OpenWeather, so a valid OpenWeather API configuration is required to enable this data.
60. Sunrise Time
Displays sunrise time for the day. Data source is Garmin's built-in weather service, requires device to support weather features (530/830 and newer models) and GPS location to be acquired.
61. Sunset Time
Displays sunset time for the day. Data source is Garmin's built-in weather service, requires device to support weather features (530/830 and newer models) and GPS location to be acquired.
IX Virtual LED
Virtual LEDs can be configured around the screen edges. Users can use LEDs in different positions to display different information.
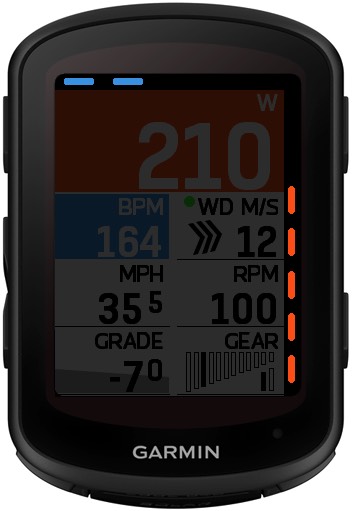
The two horizontal fields (top and bottom) of virtual LEDs now support status bars. The icons in the status bar from left to right are: battery, GPS signal status, phone connection status (conditional), unread messages (conditional), time.

When the phone is not connected to Garmin Edge, the "Bluetooth" icon will not be displayed. When there are no unread messages, the unread message icon will not be displayed. When the number of unread messages is greater than 9, "9+" will always be displayed instead of the actual number.
| Image | Status | Description |
|---|---|---|
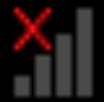 |
QUALITY_NOT_AVAILABLE | GPS not available |
 |
QUALITY_LAST_KNOWN | Location based on last known GPS position |
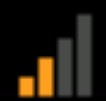 |
QUALITY_POOR | Location calculated from poor GPS fix. Only 2-D GPS position available, possibly due to limited number of tracked satellites |
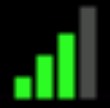 |
QUALITY_USABLE | Location calculated from usable GPS fix. 3-D GPS position available with marginal HDOP (horizontal dilution of precision) |
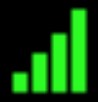 |
QUALITY_GOOD | Location calculated from good GPS fix. 3-D GPS position available with good to excellent HDOP (horizontal dilution of precision) |
Real-time Power
Virtual LEDs display the count and color for each zone (color style set to Garmin style in the example below)
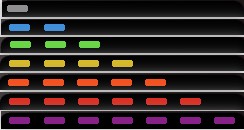
3-second Average Power
Same as above.
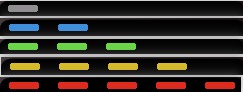
Heart Rate Zone
Virtual LEDs display the count and color for each zone (color style set to Garmin style in the example below)
Average Speed Indicator
Virtual LEDs display the relationship between current speed and average speed, with red indicating behind (below average) and blue indicating ahead (above average).
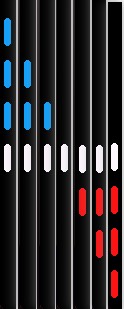
Each LED represents 10% ahead or behind, as shown in the table below. The table uses ahead as an example; behind follows the same principle.
| Example | Meaning |
|---|---|
 |
Equal to average speed |
 |
Current ahead < 10% |
 |
10% < Current ahead < 20% |
 |
Current ahead > 20% |
Average Power Indicator
Virtual LEDs display the relationship between current power and average power, with the same color meanings as above, but each LED represents 20% ahead or behind. The table uses ahead as an example; behind follows the same principle.
| Example | Meaning |
|---|---|
|
Equal to average power |
|
Current ahead < 20% |
|
20% < Current ahead < 40% |
|
Current ahead > 40% |
Left-Right Balance Indicator
Virtual LEDs display the left-right balance of current pedaling power. Each LED represents a 5% offset to one side. The table uses right-shifted pedaling as an example; the opposite follows the same principle.
Additionally, if the received left-right balance value is 100-0 or 0-100, an error state will be displayed. This situation usually occurs due to one side of a dual-sided power meter being disconnected or momentary force during first pedaling.
| Example | L - R |
|---|---|
 |
50% - 50% |
 |
45~50% - 50~55% (55% not included) |
 |
40~45% - 55~60% (60% not included) |
 |
≤40% - ≥60% |
 |
0%-100% (or 100%-0%) |
3-second Left-Right Balance Indicator
Same as above.
X Configuration Guide
This section explains the function and scope of each setting in order of the settings page. The numbers in the title boxes correspond to the position of each item on the settings page.
For field numbers mentioned in the scope, please refer to the explanations of each field above.
ActivationCode (Activation Code)
Enter the activation code in the settings page to unlock all features.
Function:
- Enter the activation code you received after purchase to activate all MyGahoo Pro features
Configuration Suggestions:
- The activation code is bound to the device, and each device requires a separate activation code
- If you log into a different account on the same device, the activation code will not change
- If you replace your device, you need to obtain a new activation code
[1.1] FTP (Watts)
FTP is the critical power value that a rider can sustain for a long time, and is a fundamental parameter for calculating multiple training metrics.
Function:
- Set the rider's functional threshold power, used to calculate power zones, power-to-weight ratio, NP, TSS, IF and other training metrics
Scope:
- Zone color division for the current power field
- Calculation of the power-to-weight ratio field
- TSS calculation related to the NP field
- Calculation of the IF field
Configuration Suggestions:
- It is recommended to use the 20-minute measured power or CP (Critical Power) as the input value
- FTP needs to be used with the weight in the Garmin profile to calculate power-to-weight ratio
- After modifying FTP, metrics such as TSS and IF will be recalculated based on the recorded NP data
[1.2] OpenWeather API Key (now supports all devices)
Used to connect to the OpenWeather service and obtain real-time weather data.
Function:
- Enter the OpenWeather API key to enable the application to obtain online weather data
Scope:
- Air temperature field
- Feels-like temperature field
- Humidity field
Configuration Suggestions:
- You need to register and obtain an API key on the OpenWeather official website yourself
- The device needs to be connected to the network through the phone
- GPS location needs to be acquired (indoor locations may not be able to obtain weather data)
[1.3] Virtual Page Scrolling Mode
Controls how users switch between different data block positions in the selected layout.
Function:
- Set whether to enable virtual scrolling, and whether to use buttons or touch operations
Configuration Suggestions:
- Off: Disable virtual scrolling, touching the screen will invoke the system native menu
- Quick Button Mode: Continuously press the "up down up down" button combination (within 2 seconds interval) to scroll backward, only supports backward scrolling
- Touch Mode: Click the left side of the lower half of the screen to scroll right, click the right side to scroll left, suitable for touchscreen devices
- Touch and Quick Button Mode: Enable both touch and button modes simultaneously
[1.4] Layout
Select the arrangement and number of data blocks on the screen.
Function:
- Determine the number and arrangement template of data blocks displayed on the screen
[1.5] Language
Select the language for the MyGahoo Pro interface display.
Function:
- Change the language used for data titles on the application interface
[2.1] Timer and Clock Format
Controls whether the time display format automatically switches based on exercise state.
Function:
- Determine the time display format, whether to always show "hours:minutes:seconds", or to automatically switch between "minutes:seconds" and "hours:minutes" formats
Configuration Suggestions:
- Choosing "Always show hours:minutes:seconds" may cause font overflow in some layouts. It is recommended to select auto-switching if there are no special requirements.
[2.2] Enable 24-hour Format
Controls whether time display uses 12-hour or 24-hour format.
Function:
- Set the time format for the clock display
[2.3.1] Average Speed Indicator
Displays the comparison between current speed and average speed.
Function:
- Display on the data block whether the current speed is higher or lower than the average speed
Configuration Suggestions:
- Off: No comparison displayed
- On - Arrow: Displayed next to the title. Up arrow means ahead, down arrow means behind
- On - Background Color: Green means ahead, red means behind
- Displayed only after the ride starts, not displayed when stationary
[2.3.2] Average Power Indicator
Displays the comparison between current power and average power.
Function:
- Display on the data block whether the current power is higher or lower than the average power
Configuration Suggestions:
- Off: No comparison displayed
- On - Arrow: Displayed next to the title. Up arrow means ahead, down arrow means behind
- Note: This indicator only supports arrow mode, not background color mode
[2.3.3] Average Heart Rate Indicator
Displays the comparison between current heart rate and average heart rate.
Function:
- Display on the data block whether the current heart rate is higher or lower than the average heart rate
Configuration Suggestions:
- Off: No comparison displayed
- On - Arrow: Displayed next to the title. Up arrow means ahead, down arrow means behind
- Note: This indicator only supports arrow mode, not background color mode
[2.3.4] Average Cadence Indicator
Displays the comparison between current cadence and average cadence.
Function:
- Display on the data block whether the current cadence is higher or lower than the average cadence
Configuration Suggestions:
- Off: No comparison displayed
- On - Arrow: Displayed next to the title. Up arrow means ahead, down arrow means behind
- On - Background Color: Green means ahead, red means behind
[2.4] Use Relative Wind Direction (arrows change according to riding direction)
Set whether wind direction is relative to riding direction or geographical actual direction.
Function:
- Control the pointing direction of wind direction arrows
Configuration Suggestions:
- On: Arrows change with riding direction, always showing which direction the wind is coming from. When you turn, the arrows will follow the change.
- Off: Shows the actual geographical wind direction, not changing with riding direction. When the arrow points down, it means the current wind is from the north; when pointing left, it means east, and so on.
[2.5] Wind Speed Unit
Set the unit for wind speed display.
Function:
- Control the display unit of wind speed data
Configuration Suggestions:
- Meters per second: Standard meteorological unit
- Kilometers per hour: Common cycling speed unit
- Miles per hour: Imperial unit
- Beaufort Scale: Levels 0~12, wind force level converted from wind speed
[2.6] Heart Rate Color Style
Set the color scheme for heart rate zones.
Function:
- Choose the zone color style used for heart rate data
Scope:
- Background color of the current heart rate field
- Virtual LED heart rate zone display (when LED is set to heart rate)
[2.7] Power Color Style
Set the color scheme for power zones.
Function:
- Choose the zone color style used for power data
Scope:
- Background color of the current power field
- Background color of various average power fields
- Virtual LED power zone display (when LED is set to power)
[2.8] Background Color
Set the background theme for the entire data field.
Function:
- Control the overall background color style of the application
Configuration Suggestions:
- Follow System: Automatically follow the device's current day/night mode
- Always Day: Always use the daytime white background
- Always Night: Always use the nighttime black background
[2.9] Show Leading Zeros in Time Format
Control whether time display shows leading zeros.
Function:
- Set whether time numbers are displayed with zero padding
Configuration Suggestions:
- On: 9:05 is displayed as "09:05"
- Off: 9:05 is displayed as "9:05"
[2.10] [W'Bal] CP (W) / W' (J) / Display Mode / Algorithm
This group of settings together controls the calculation and display of the W'Balance feature.
CP (Critical Power)
The upper power limit that a rider can sustain for a long time, and also the threshold for W'Balance depletion/recovery judgment.
Function:
- Depletion/recovery judgment for the W'Balance field
- When power is higher than CP, W'Balance is depleted; when lower than CP, W'Balance is recovered
Configuration Suggestions:
- If you clearly know your CP, set it to CP; if you don't know, you can approximate it to FTP
WPRIME (W' Energy Reserve)
The total energy reserve that a rider can output above CP.
Configuration Suggestions:
- Default value is approximately 10,000 joules (10 kilojoules)
- Experienced riders usually set it in the range of 15,000~20,000 joules
Display Mode
Set how the W'Balance data is displayed.
Function:
- Choose whether to display as percentage or kilojoules, and whether to include colors
Configuration Suggestions:
- Percentage: Display remaining percentage, with colors (green=recovering, red=depleting)
- Kilojoules: Display remaining energy value, with colors
- Percentage (No Color): Display remaining percentage, without colors
- Kilojoules (No Color): Display remaining energy value, without colors
Algorithm
Select the calculation model for W'Balance.
Configuration Suggestions:
- Integral Algorithm: Both depletion and recovery are slower and smoother, suitable for endurance riding
- Differential Algorithm: Fast depletion, fast recovery, and more responsive, suitable for interval training
[2.11] Enable Top-Right Title Offset (Avoid Radar Icon Overlap)
Set whether the top-right title is offset to the right to avoid overlap with radar icons.
Configuration Suggestions:
- Only need to enable when using Garmin radar function
- Disabled by default
[2.12] Gear Chart - 1X Single Chainring Mode
Set whether the gear ratio chart is displayed in 1X single chainring mode.
Configuration Suggestions:
- After enabling: The gear ratio chart will only display the cassette chart, not the chainring chart
- After disabling: By default, both cassette and chainring charts are displayed
[3.1-3.4] Left LED / Right LED / Top LED / Bottom LED
Virtual LEDs can be configured on the four edges of the screen, used to display different types of data.
Function:
- Display power/zones, average indicators, left-right balance, or status bars on the screen edges
Scope:
- Power zone LED: Affects the zone visualization of current power and various average power fields
- Heart rate zone LED: Affects the zone visualization of the current heart rate field
- Average indicator LED: Affects the ahead/behind display of average data
- Left-right balance LED: Affects the visualization of the left-right balance field
- Status bar LED: Displays status icons such as battery, GPS, Bluetooth connection, time, etc.
Configuration Description:
| Position | Selectable Content |
|---|---|
| Left LED (3.1) | Off / 3-second Power Zone / Power Zone / Heart Rate Zone / Average Speed Indicator / Average Power Indicator |
| Right LED (3.2) | Off / 3-second Power Zone / Power Zone / Heart Rate Zone / Average Speed Indicator / Average Power Indicator |
| Top LED (3.3) | Off / Status Bar / 3-second Power Zone / Power Zone / Heart Rate Zone / Average Speed Indicator / Average Power Indicator / Left-Right Power Balance / 3-second Left-Right Balance |
| Bottom LED (3.4) | Off / Status Bar / 3-second Power Zone / Power Zone / Heart Rate Zone / Average Speed Indicator / Average Power Indicator / Left-Right Power Balance / 3-second Left-Right Balance |
Configuration Suggestions:
- Off: No LED displayed on this edge
- Status Bar: Available for top and bottom only, displays battery icon, GPS signal status, phone connection status, unread message count, current time
- Power/Heart Rate Zone: 7 LEDs display the count distribution for each power/heart rate zone
- Average Indicator: Blue means ahead, red means behind
- Left-Right Balance: Dedicated for top and bottom LEDs, each LED represents a 5% offset to one side
Left-Right Balance LED Error State
If the left-right balance value shows 100-0 or 0-100, an error state will be displayed. This is usually caused by one side of a dual-sided power meter being disconnected or momentary force during first pedaling.
Enable Pages
Controls whether to enable Page 2 and Page 3.
Scope:
- Whether the page switching function is available
- Page number not displayed in single-page mode
Configuration Suggestions:
- Page 1 is always enabled and cannot be turned off
- After enabling multiple pages, users can switch pages through virtual scrolling or touch operations
- Each page can independently set the MainBlock and data block types for left and right sides
Relationship between Pages and Layouts
Multi-page settings allow users to configure multiple sets of different data block combinations, each set using the same layout style but with different data blocks displayed.